NAVGEM Model | Atlantic

NAVGEM Model Description
The NAVGEM (Navy Global Environmental Model) replaced the NOGAPS model and became fully operational on March 13, 2013. After rigorous testing, the FNMOC concluded that the NAVGEM showed "across the board improvement in forecast skill" over the NOGAPS. The NOGAPS model has now been completely decommissioned.
Over land, we send up weather balloons to show a vertical slice of the air, called a sounding. Over water, reconnaissance aircraft drop dropsondes into the hurricane wind field to get a 3-D view of the atmosphere. The NAVGEM model uses synthetic soundings at points around the tropical cyclone based on the current position of the storm and creates a realistic 3-D model even when soundings or dropsondes are not available in real time.
Having a better handle on and realistic 3-D model of the initial position and intensity also helps in forecasting the future position and intensity.
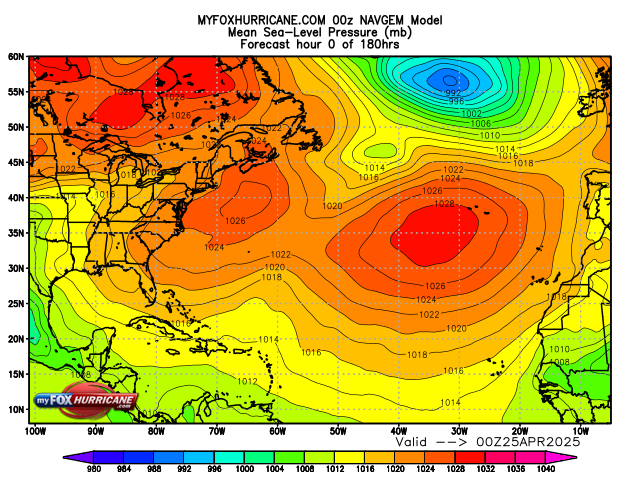
The graphics to the right show the barometric pressure field. Lower pressures are indicated in dark blue. Higher pressures are indicated in red. Hurricanes and tropical storms, as well as non-tropical low-pressure areas, are associated with low pressure (blue).
The white lines are isobars (lines of equal pressure). The closer the lines are to each other, the stronger the winds.
Remember that these are mathematical models with varying initial assumptions. Thus, different models produce different final results. They do not necessarily reflect the "official" hurricane track issued by the National Hurricane Center. Forecasters review all of the model data but use their own experience and scientific expertise to arrive at a final forecast
Additional Weather Maps
-

ECMWF Model | Atlantic
-
GFS Model | Atlantic
-
WRF Atlantic Model
-
NAVGEM Model | Caribbean
Storm Preparation Guide
county-by-county pages
 Click on your county above for specific evacuation zones, and emergency contacts.